Using the Azure Synapse Analytics Workspace Data Source Connector in Power BI
Using the Azure Time Series Insights Data Source Connector in Power BI
Azure Time Series Insights (TSI) is a fully managed analytics, storage, and visualization service that helps organizations manage time-series data generated by IoT devices. When integrated with Power BI, it allows users to perform advanced analytics and visualize data efficiently. In this post, we will guide you through the steps to use the Azure Time Series Insights Data Source Connector in Power BI, offering you a detailed approach to harnessing the power of both platforms.
Why Integrate Azure Time Series Insights with Power BI?
Integrating Azure Time Series Insights with Power BI provides several benefits:
- Advanced Visualization: Power BI offers a wide range of visualization tools that enhance the analysis of time-series data.
- Data Connectivity: Seamlessly connect and query large datasets from Azure TSI directly in Power BI.
- Real-time Analytics: Analyze and visualize real-time data streams to make data-driven decisions quickly.
- Custom Reporting: Create custom reports and dashboards tailored to specific business needs.
Prerequisites for Using Azure Time Series Insights in Power BI
Before you start, ensure you have the following prerequisites in place:
- An Azure subscription with Azure Time Series Insights configured.
- Power BI Desktop installed on your local machine. You can download it from the Power BI website.
- Access to the Azure Time Series Insights API with necessary credentials.
- Permissions to access the Azure TSI environment and data.
Step-by-Step Guide to Connect Azure Time Series Insights to Power BI
Step 1: Open Power BI Desktop
Start by launching the Power BI Desktop application on your local machine. Ensure you are using the latest version to access all available features.
Step 2: Get Data from Azure Time Series Insights
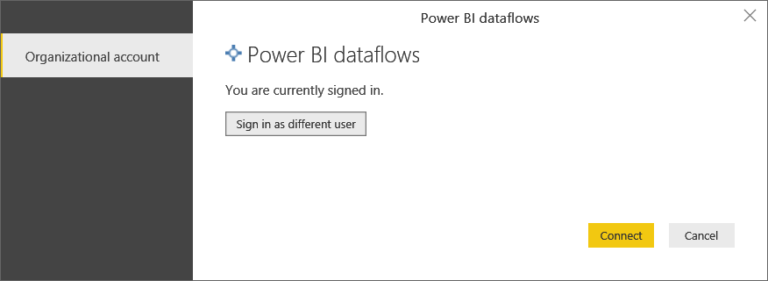
Click on the Home tab and select Get Data. In the search box, type “Azure Time Series Insights” and select it from the list of available connectors. Click on Connect to proceed.
Step 3: Enter Connection Details
In the connection window, provide the following details:
- Environment URL: This is the URL of your Azure TSI environment. You can find it in the Azure portal under your TSI environment settings.
- Authentication Method: Choose the authentication method suitable for your setup. The most common options are OAuth2 or API Key.
- API Key: If you choose API Key as your authentication method, enter the key obtained from the Azure portal.
After entering the required details, click OK to establish a connection.
Step 4: Select Time Series Data
Once connected, a navigator window will appear, showing the available time series data in your Azure TSI environment. Browse through the datasets, select the ones you need, and click Load to import the data into Power BI.
Step 5: Transform and Prepare Data
After loading the data, use Power BI’s Power Query Editor to transform and shape the data as needed. You can remove unnecessary columns, filter rows, create new calculated columns, and more to prepare your data for visualization.
Step 6: Create Visualizations
With your data loaded and prepared, you can start creating visualizations. Use various chart types like line charts, bar charts, scatter plots, and more to represent your time series data effectively. Customize your visualizations with titles, labels, colors, and filters to enhance readability and insights.
Step 7: Publish to Power BI Service
Once you are satisfied with your report, click on the File tab and select Publish. Choose Power BI Service as the destination. You will be prompted to sign in with your Power BI credentials. After signing in, select the workspace where you want to publish the report and click Publish.
Step 8: Share and Collaborate
After publishing your report to the Power BI Service, you can share it with your colleagues and stakeholders. Use Power BI’s sharing and collaboration features to control access and permissions, ensuring that only authorized users can view or edit the reports.
Best Practices for Using Azure Time Series Insights with Power BI
To get the most out of your Azure TSI and Power BI integration, consider the following best practices:
- Optimize Data Models: Use efficient data modeling techniques to reduce load times and improve performance.
- Use Filters and Aggregations: Apply filters and aggregations at the data source level to minimize the volume of data transferred to Power BI.
- Monitor Performance: Regularly monitor the performance of your Power BI reports and optimize them as needed.
- Maintain Data Security: Ensure that data is accessed and shared securely by using Azure’s security features and Power BI’s role-based access control.
Conclusion
Integrating Azure Time Series Insights with Power BI empowers organizations to leverage real-time data and advanced analytics for informed decision-making. By following the steps outlined in this guide, you can efficiently connect, analyze, and visualize your time-series data, unlocking valuable insights for your business. Start leveraging the power of Azure TSI and Power BI today to stay ahead in the competitive market landscape.
For further reading, check out the official documentation on Azure Time Series Insights and Power BI.