Power BI DA-100: Edit and configure interactions between visuals
Exam DA-100 | Edit and configure interactions between visuals
In this series of blog posts, we will be examining some of the key features of Power BI Desktop, Power Query and the Power BI Service needed to pass exam DA-100: Analyzing Data with Microsoft Power BI. The series was originally mapped to the MCSA: BI Reporting; however, the topics covered are also relevant to the newer exam DA-100.
In this post, we will examine the DA-100 topic Visualize the Data > Enrich reports for usability > Edit and configure interactions between visuals.

This is a very straightforward topic which is related to the control of the interaction between visuals and, specifically, which other visuals on the page will be filtered, cross-filtered or cross-highlighted when the user interacts with a given visual.
Controlling Filtering
In the screenshot shown below, we have a KPI visual entitled “6 Year Trend”. Given this title, we would always want the visual to evaluate a 6-year period when producing its result. However, we also have a slicer on the page which allows the user to filter the page for a particular year. So, when the user clicks on a particular year, we need to ensure that our KPI visual ignores this filter and continues to evaluate all years in the dataset.
To do this, highlight the visual with which the user will interact (in this case, the “Year” slicer) and click Format > Edit Interactions. A lot of people get confused as to which visual to select? The rule is simple: always select the visual whose response you wish to specify, the visual on which the user will actually click.

In “Edit Interactions” mode, buttons are displayed above or below each of the visuals on the page (with the exception of the selected visual). If the selected visual is a slicer, two buttons will be displayed “Filter” and “None”. So, to stop our “Year” slicer from filtering the KPI visual, we simply click on the “None” button below the visual

The KPI visual will now ignore any filtering on the “Year” slicer and will always display a result based on all years in the dataset

Controlling Cross-Filtering
By default, every visual that you add to a page will influence the filtering in every other visual on the page. This process is referred to as cross-filtering.
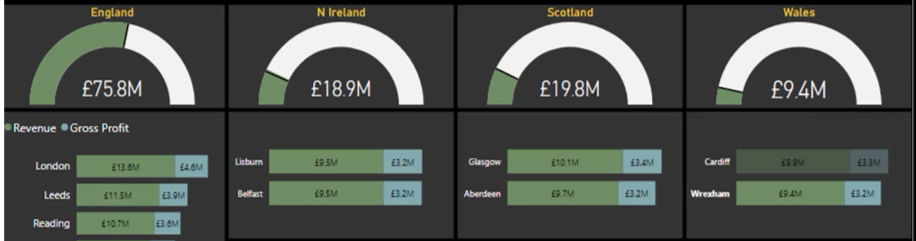
In our scenario, we need to create four distinct groups of visuals, each consisting of a gauge and the related bar chart.
Thus, for example, we want the bars in the Wales bar chart to influence only the Wales gauge and to have no effect whatsoever on the other gauges and bar charts.

To create these visual interactive groupings, we highlight each of the bar charts and click on the “None” option of the three unrelated bar charts and the three unrelated gauges.

Cross-Filtering and Cross-Highlighting
There are three types of visual interaction:
- Filter
- Highlight
- None
The default interaction is Highlight. However, this can be changed to Filter by clicking Options and Settings > Options > Report Settings > Visual Options > Change default visual ineraction from cross-highlighting to cross-filtering.

It is also worth pointing out that, when specifying visual interaction, selecting a big picture visual is pointless; since the user cannot interact with these visuals; namely, the Card, the KPI visual and the Gauge.