Power BI MCSA Certification Training Tips – Part 8: What-if Parameters
To obtain your MCSA: BI Reporting you need to pass two exams: 70-778 (Analyzing and Visualizing Data with Power BI) and 70-779 (Analyzing and Visualizing Data with Excel). However, there is a huge overlap between the two exams resulting from the common BI features found in both Power BI and Excel: namely data modelling using the DAX language; and data connection and transformation using the M language.
We, at G Com Solutions, recommend to the clients to whom we supply Power BI Training that they prepare for both exams simultaneously and then sit both exams on the same day. We also run a 5 day Power BI MCSA Certification Prep course in London which includes both exams 70-778 and 70-779.
In this series of blog posts, we will be examining some of the key features of Power BI, Power Pivot and Power Query which you will need to master in order to pass the two exams.
This topic applies only to Power BI and exam 70-778.
Power BI Desktop’s What if parameters allow you to parameterize key aspects of your data and to expose these parameters to your audience in the form of slicers.
Components of a Parameter
The parameters created automatically by Power BI consist of three elements:
-
-
- A single column table of numeric values.
- A slicer linked to the table and allowing the user to select a value in the table. (This element is optional.)
- A measure which references the selected value in the table or a default value if either no value, or more than one value, is selected.
-
By referencing the measure created by Power BI in your own calculations, you can allow your users’ current selection to influence the result they produce.
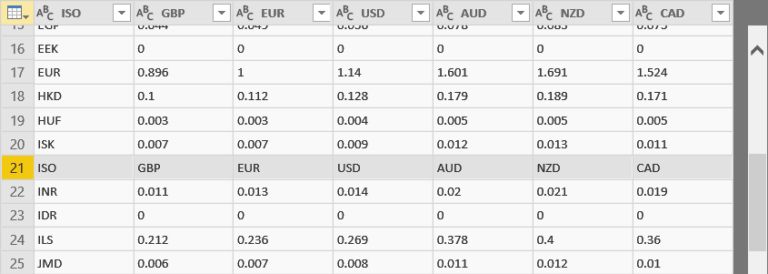
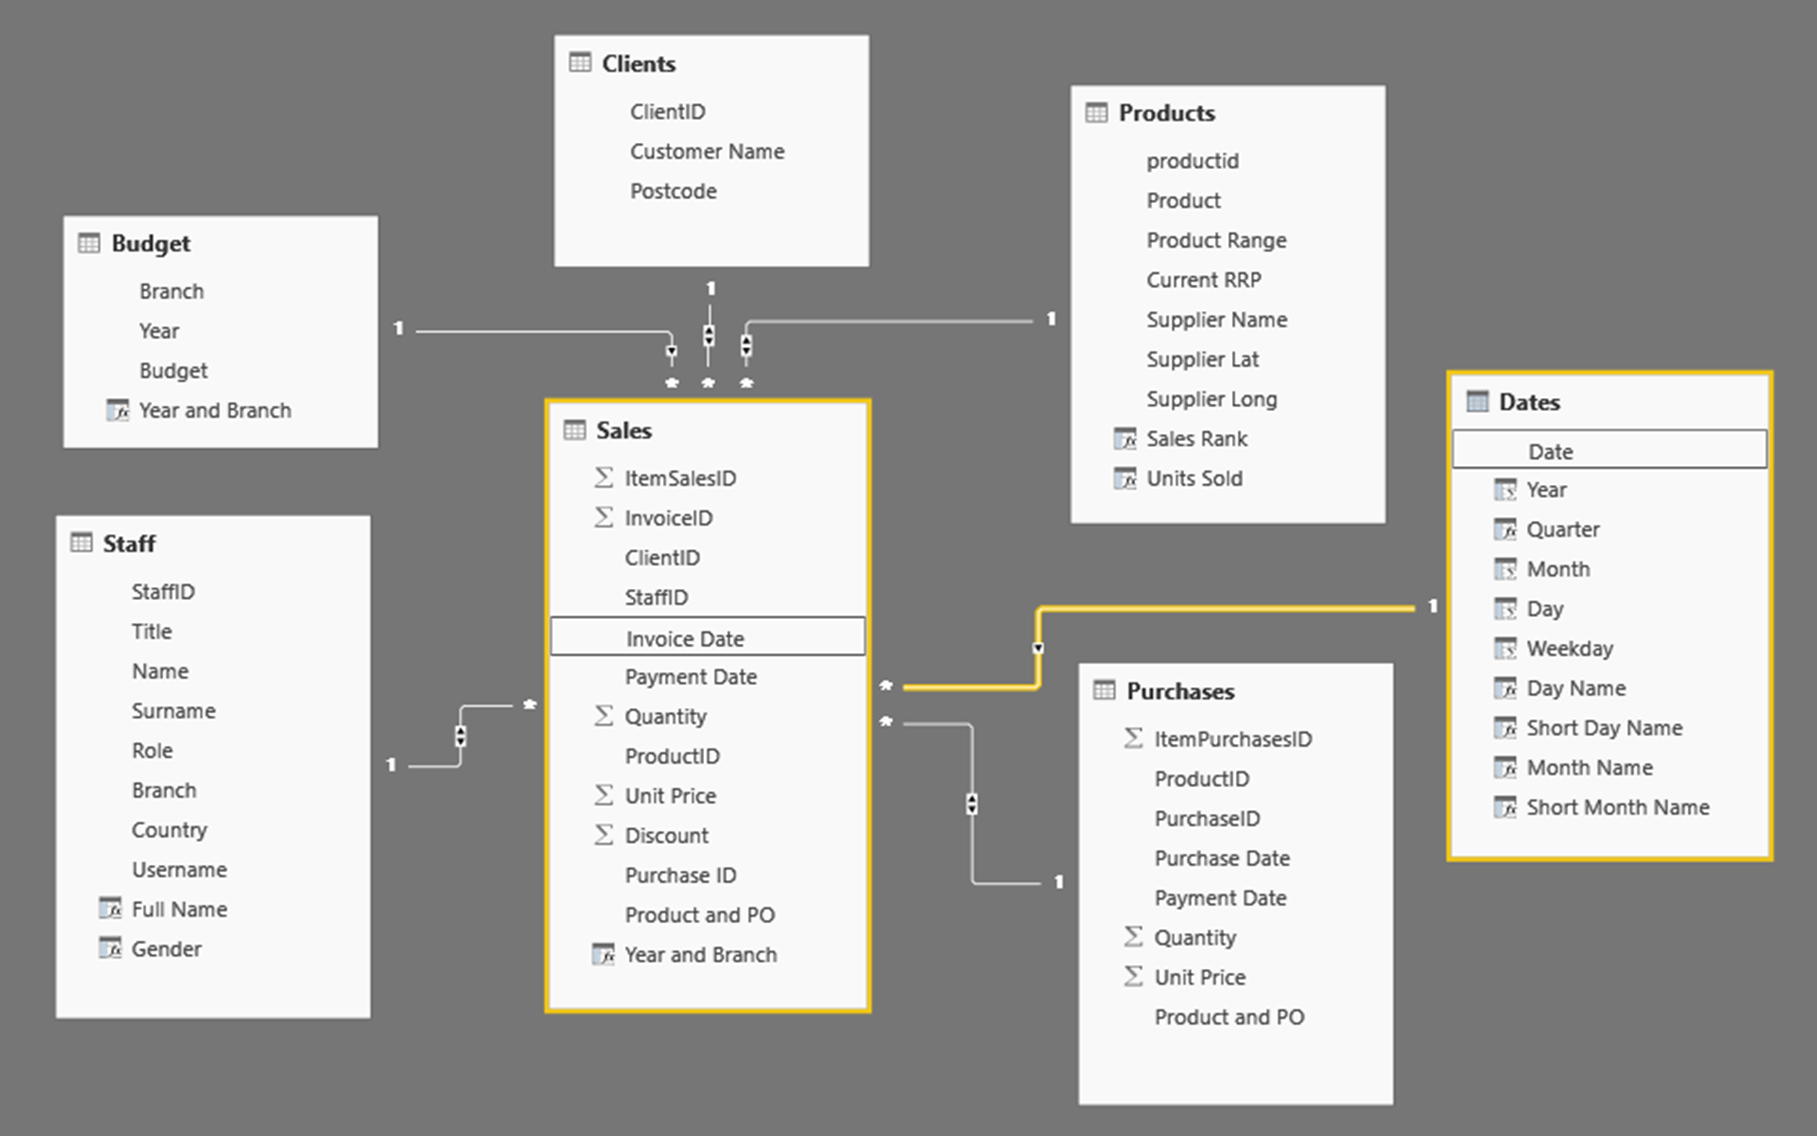
Let us take an example, using the data model shown below.
Let us say that we have created a formula for calculating the revenue of the previous quarter:
Revenue Prev Qtr =
CALCULATE(
[Revenue],
DATEADD(
Dates[Date],
-1,
QUARTER
)
)
When creating reports for large audiences, it is sometimes difficult to anticipate all the comparisons they might wish to make. So, let us allow the user to decide which quarter we want to compare with the current: two quarters back, one quarter in the future, and so forth.
The arguments of the DATEADD function are as follows:
DATEADD(<dates>,<Number_Of_Intervals>,<Interval>) as table
The function takes three obligatory parameters:
<Dates> A column containing dates (usually the date column of your calendar table)
<Number_Of_Intervals> The number of units to add to or subtract from the dates
<Interval> The time unit to be used: Year, Quarter, Month or Day.
The argument which will be supplied by the user will be the <Number_Of_Intervals>; and let us say that we want the range to be between -4 and 4.
Creating a Parameter
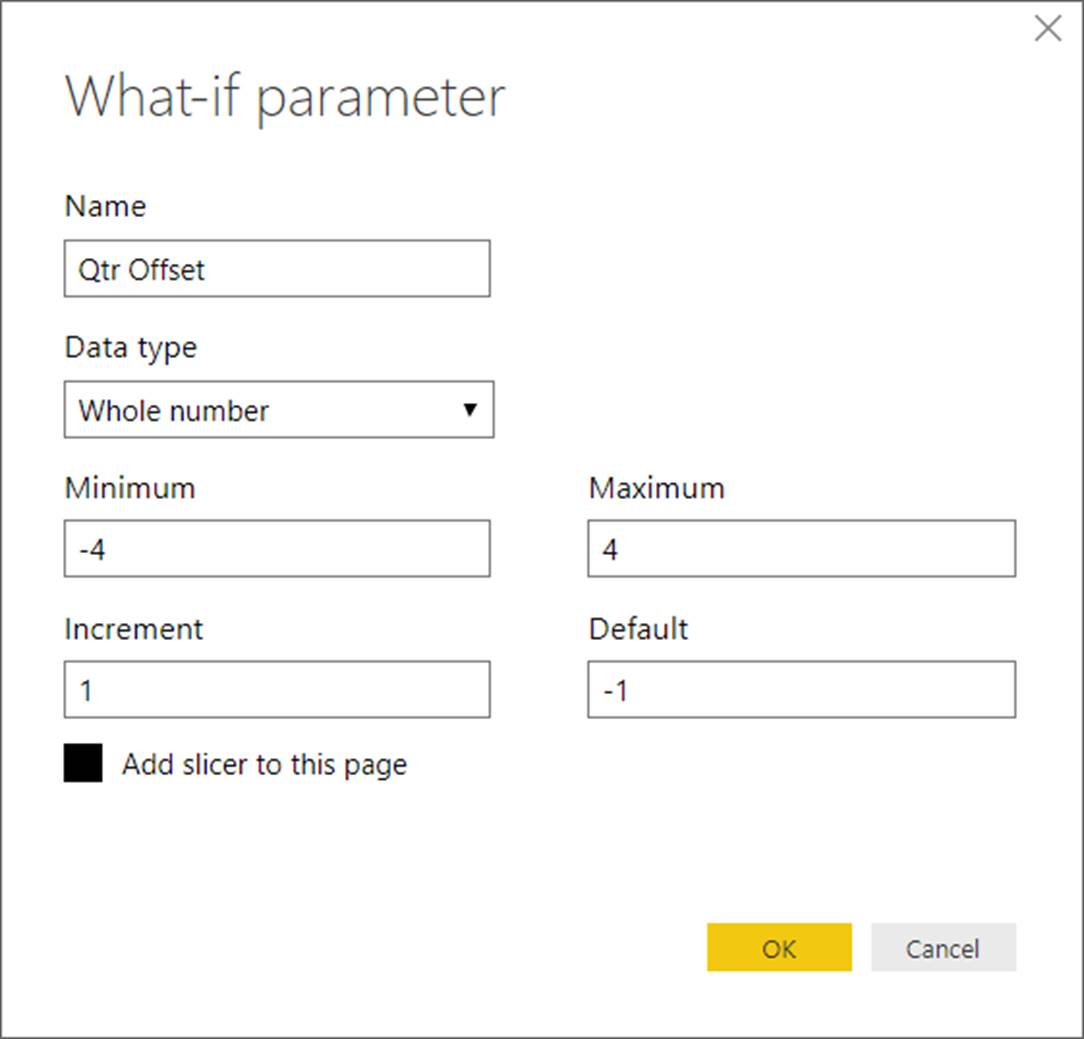
To use Power BI’s DAX parameter feature, click Modeling > What If > New Parameter. In the dialog which appears, let us enter the Name “Qtr Offset”; set the Data Type to “Whole Number”; the Minimum to “-4”; the Maximum to “4”; the Increment to “1”; the Default to “-1”; and activate the check box next to the option Add slicer to this page.
When you click OK, Power BI creates the aforementioned table, measure and slicer. The name of the table will match the name you entered when creating the parameter; and the name of the measure will simply be the name of the table followed by “ Value”. Thus, in this case, we end up with a measure called “Qtr Offset Value”.
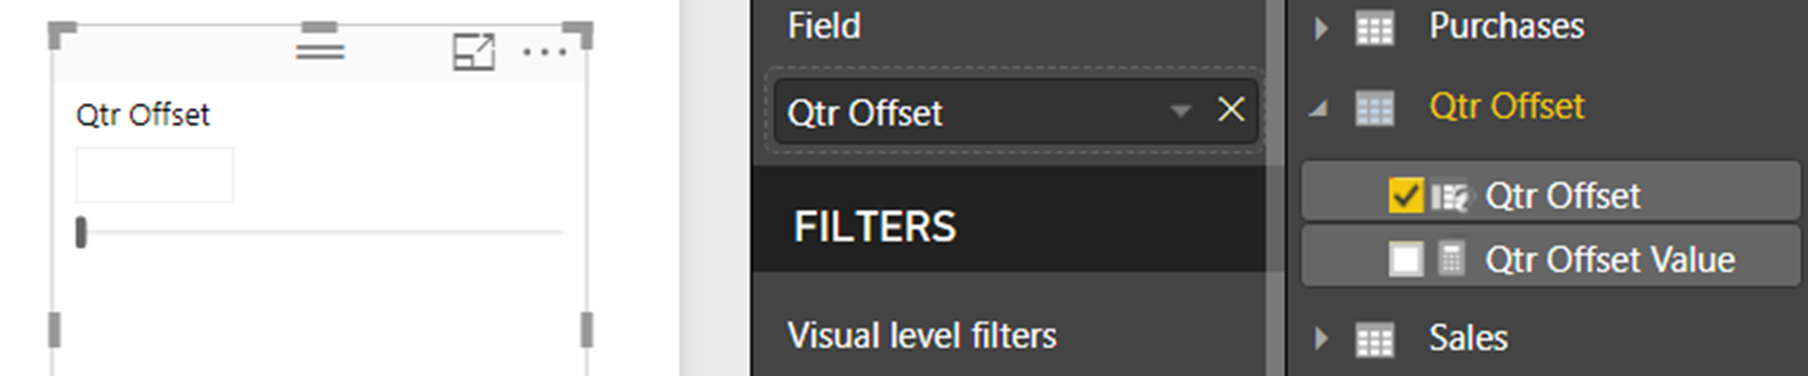
The slicer created has no value selected; and, therefore, the default value entered will apply until the user selects a value via the slicer.
Syntax of the Parameter Measure
The measure created by Power BI when creating the parameter uses the DAX SELECTEDVALUE function. The syntax of this function is shown below.
SELECTEDVALUE(<columnName>[, <AlternateResult>]) as scalar value
The function takes one obligatory, and one optional, parameter:
<columnName> A literal reference to a table column (i.e., not an expression)
<AlternateResult> [Optional] The value to be returned if <columnName> has not
been filtered down to a single value. (Default is BLANK()).
If we examine the syntax of the measure that has just been created for us, in this example, we find the following formula.
Qtr Offset Value = SELECTEDVALUE(‘Qtr Offset'[Qtr Offset], -1)
Notice how the default value we entered when creating the parameter (“-1”) has been used as the value for the <AlternateResult> argument of the SELECTEDVALUE function.
Referencing the Parameter Measure
We can now create a measure which references the “Qtr Offset Value” measure created for us automatically by Power BI and calculates the revenue offset by the number of quarters specified by the user.
Revenue Qtr Offset =
CALCULATE(
[Revenue],
DATEADD(
Dates[Date],
[Qtr Offset Value],
QUARTER
)
)
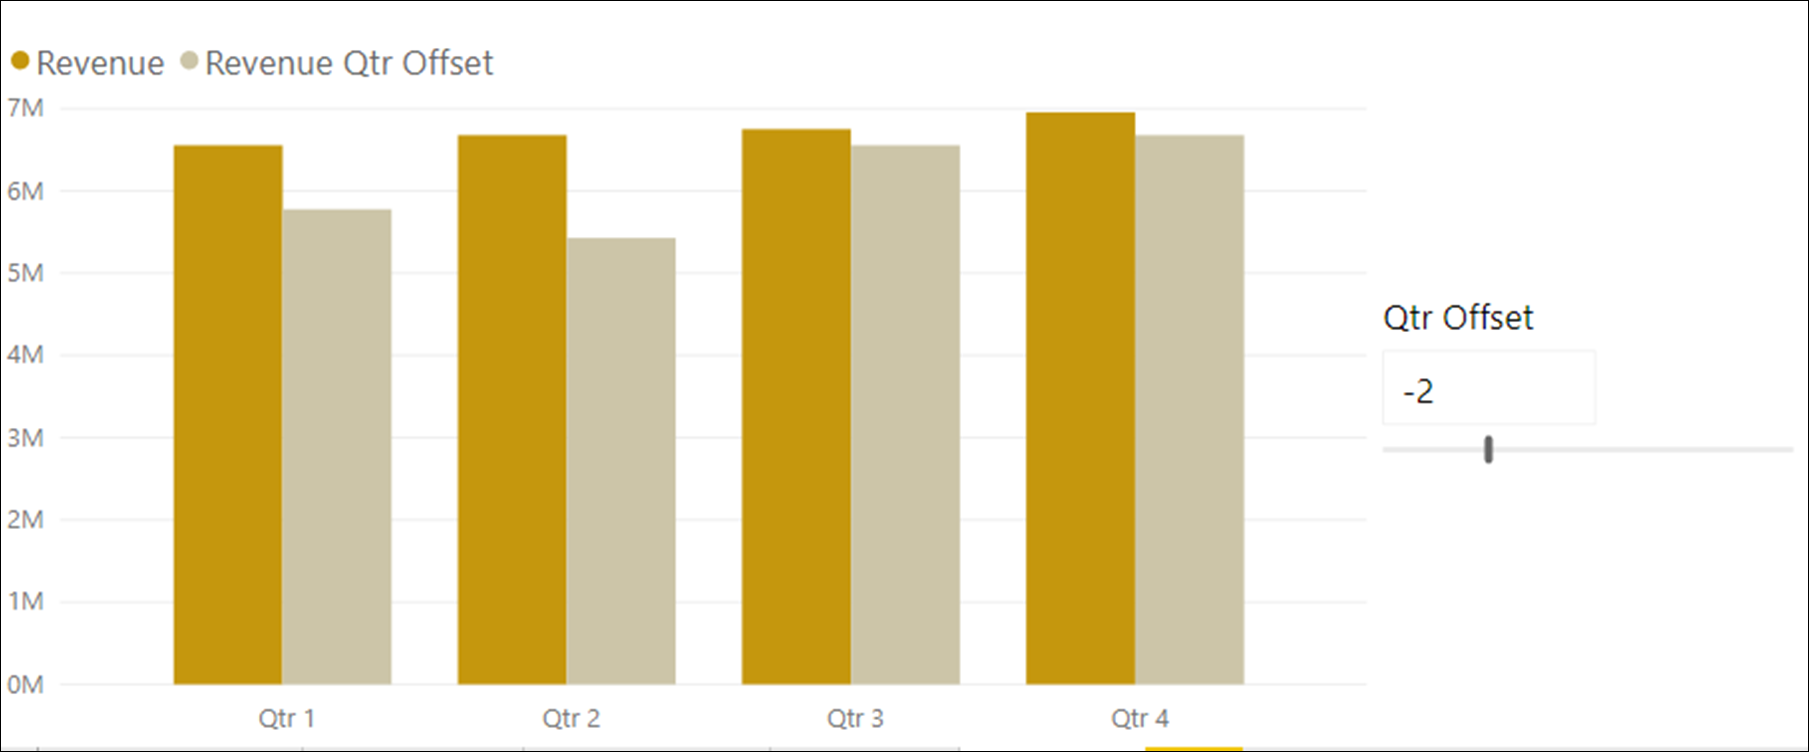
The measure is identical to the one we saw earlier for calculating the revenue for the previous quarter. However, this time, in specifying the <Number_Of_Intervals> argument, we have replaced the “-1” with the new “Qtr Offset Value” measure. If we place the Revenue Qtr Offset measure on a bar chart, alongside the Revenue, as the user interacts with the slider, the number of quarters offset will change. Thus, for example, in the illustration below, the user has set the value to “-2”.