The CALCULATE Function is a DAX TARDIS
In spite of its bland name, the CALCULATE function is the most important function in the DAX language and by far the most widely used in advanced DAX calculations. The power of the CALCULATE function stems from the fact that it allows you to change the context in which a DAX calculation takes place.
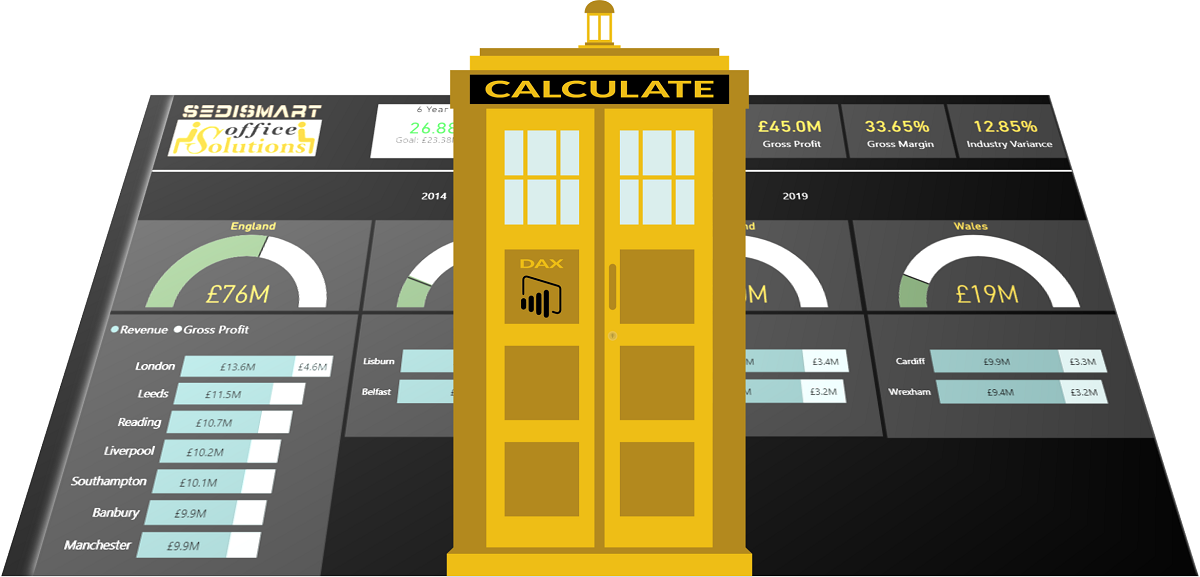
One of the easiest ways to understand what CALCULATE is capable of doing within a DAX formula is to think of it as a DAX version of Dr Who’s TARDIS. Just as the TARDIS has its own ecosystem and can travel through time, CALCULATE can perform a computation in a context completely independent of that created by the filter mechanisms on the page; and it also makes “time travel” a cinch.
The visuals on the page are asking us to perform our calculation in a particular context. However, if we place our calculation inside the CALCULATE function, we can either modify this filter context or create a new one.
Normally, a DAX calculation either takes place in the context of a table row or in the context of the combination of filter mechanisms applied to the visual in which a measure has been placed.
Row Context
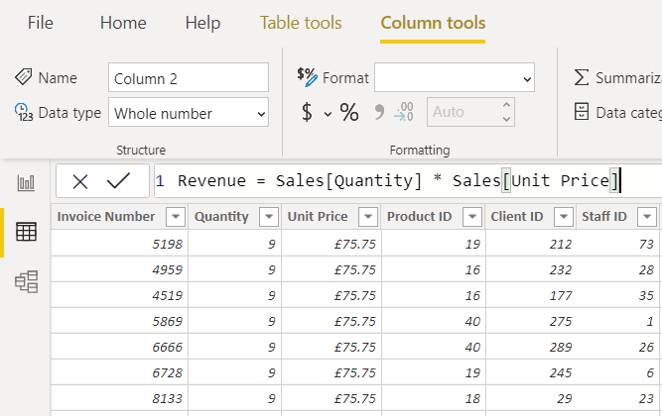
If you create a calculated column, the DAX formula used to create the column will be evaluated for each row of the table in which the column is being created.
Thus, in the illustration shown below, a calculated column called “Revenue” is being created by multiplying Quantity and Unit Price. The DAX Calculation Revenue = Sales[Quantity] * Sales[Unit Price] is taking place in the context of each row in the Sales table.
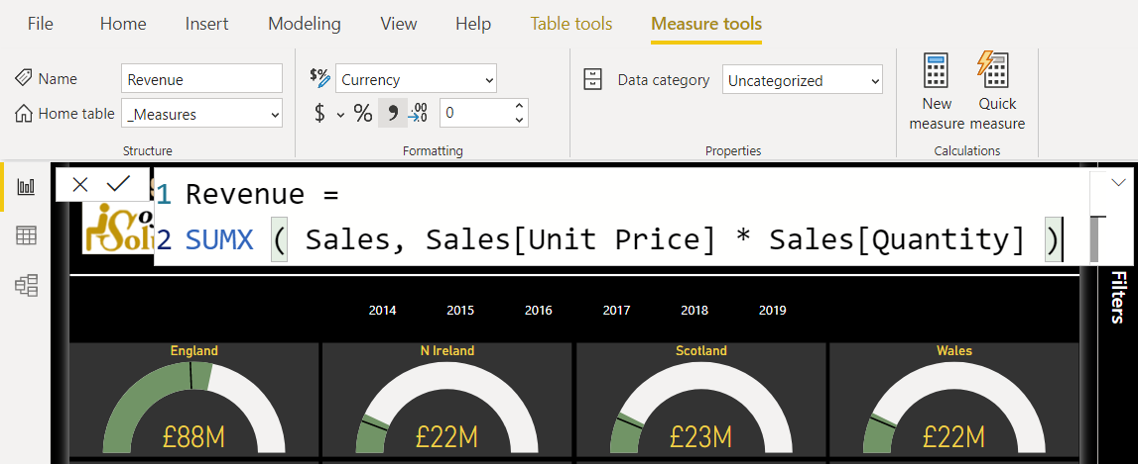
However, row context can also be created within a measure. Thus, for example, if we decide to calculate revenue as a measure instead of creating a calculated column, we could use the formula Revenue = SUMX(Sales, Sales[Quantity] * Sales[Unit Price]). The SUMX function creates a filter context and iterates through the rows in the Sales table, generating an in-memory calculated column which it then aggregates.
Filter Context
Row context applies when a calculation is taking place within the rows of a table. By contrast, filter context normally applies to measures which have been placed within visuals on the report page. Filter context is the combined set of filters, typically those imposed by the user interface, which impact the result produced by a DAX calculation, typically a measure.
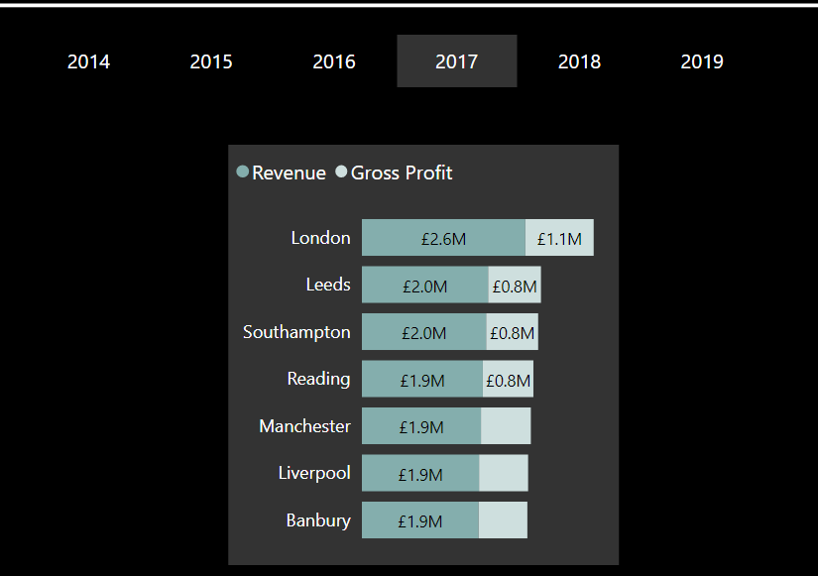
Thus, for example, if we place our Revenue and Gross Profit measures in a stacked bar chart visual with the Branch column on the axis, each calculation takes place in the context of the Branch filter imposed within the visual and Revenue and Gross Profit are calculated for each branch.
If we now select a specific year in a year slicer, say 2017, our Revenue and Gross Profit measures are now being calculated for each branch for 2017 only.
So, our measure is being constantly implicitly impacted by the filter context created on the page as we interact with our visuals. (Implicitly, because we don’t actually see the DAX being generated, unless we use a tool like the Performance Analyzer.)
Overriding the Filter Context with CALCULATE
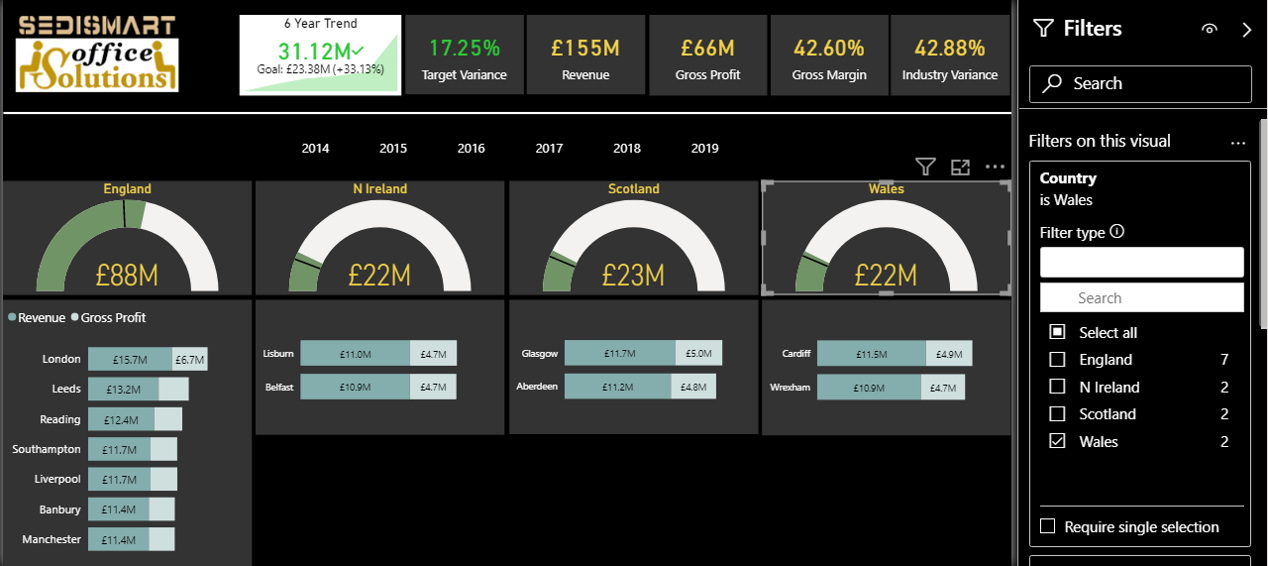
There are many occasions where we need to perform a calculation in a context which is not dictated by the visual in which we place our measure. For example, the highlightedgauge visual shown below is displaying the total revenue for sales in Wales, compared with target sales. The 180° arc described the gauge represents the total sales across all countries, while the filled area represents the sales for Wales only. A visual-level filter has been applied to each of the four gauges which sets the Country to "England", "N Ireland", "Scotland" or "Wales", respectively.
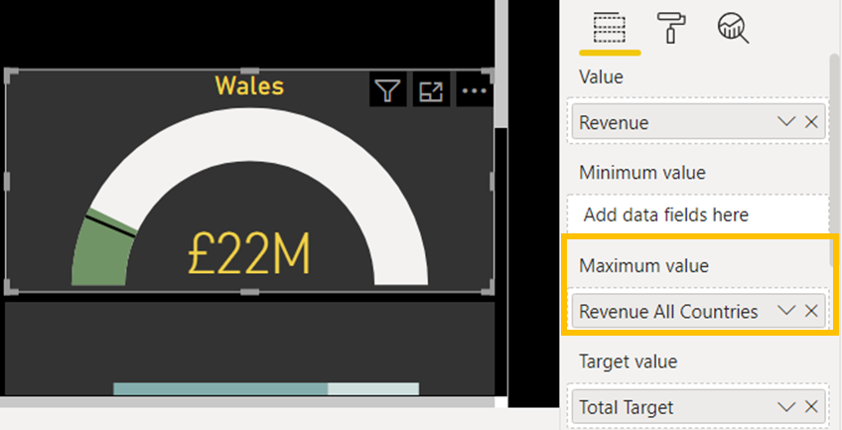
Gauges have four key settings: Value (Actual), Minimum, Maximum, Target. (The Minimum defaults to zero and can therefore be ignored.) The country filter applies to the Value and Target, but it does not affect the Maximum. If it did the filled area would always cover the entire gauge, since maximum and actual value would both be filtered. To get the Maximum to ignore the Country filter applied to the visual, we have created a separate measure called [Revenue All Countries] and used it to calculate the gauge Maximum.
The formula uses the following code:
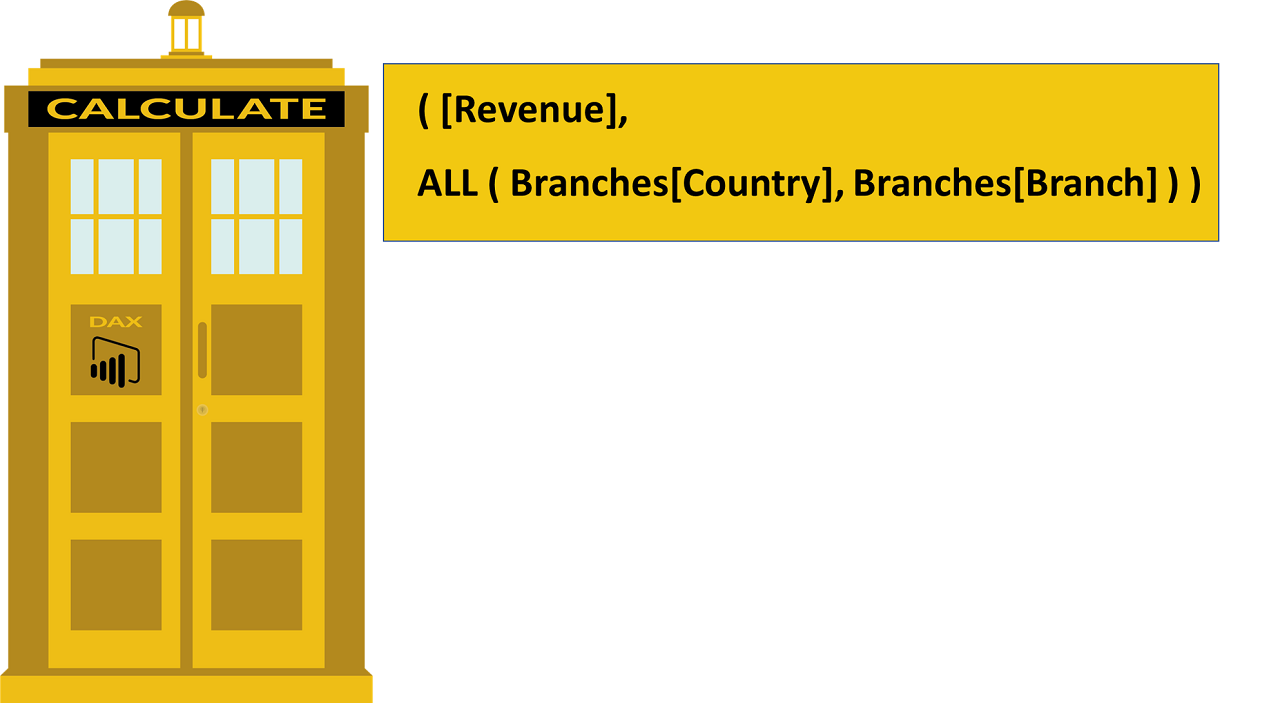
Revenue All Countries =

    CALCULATE(

  [Revenue],

  ALL(Branches[Country], Branches[Branch])

  )
In order to get our [Revenue All Countries] measure to override the Countries filter applied to each gauge visual, we turn to our DAX TARDIS, the CALCULATE function. The gauge visual says: "I am filtered for a specific country"; but, by using CALCULATE with the ALL function which ignores filters on the specified column(s), we create an override which says: "For this calculation, there is no filter on Country or Branch".
Using CALCULATE For Time Travel
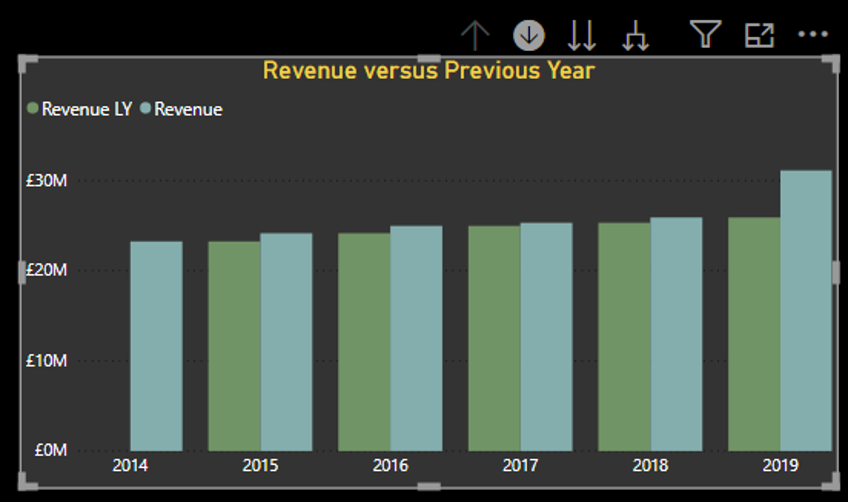
Time based calculations are a frequent requirement in Power BI: year-to-date, month-to-date, last-year revenue, etc. It is also very common that we need to compare and display different time periods on the same visual. For example, on the chart shown below, we have a date hierarchy on the axis which allows us to use the drill-down feature. In the values area, we are displaying both Revenue and Revenue Last Year. On the first level of the hierarchy, we compare current year revenue to last years revenue.
Then, if we drill into the year 2018, drilling down from years to months, we are now able to compare each months’ revenue for 2018 with the corresponding month of the previous year.
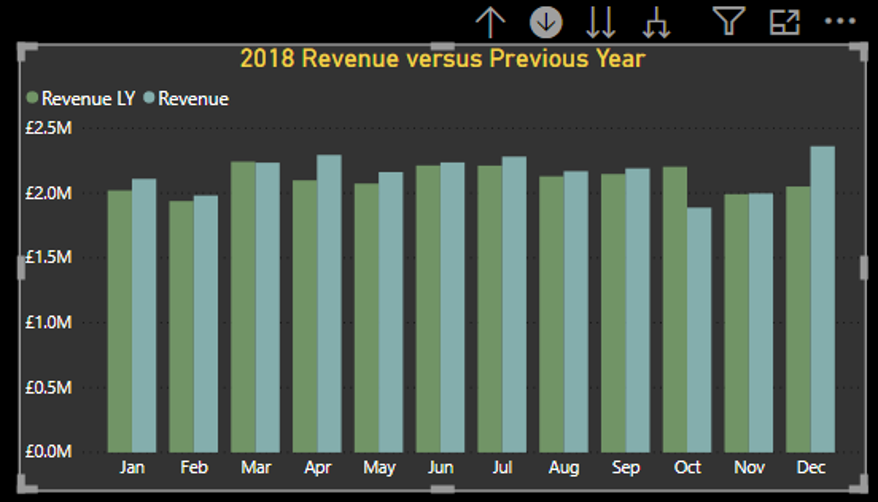
In this last example, the visual is filtering the revenue for each month in 2018 and the Revenue measure is being filtered predictably, but our second measure Revenue LY uses the CALCULATE function in conjunction with SAMEPERIODLASTYEAR (one of the many time-intelligence functions provided by the DAX language) to shift the time period back one year in time. The formula uses the following code:
Revenue LY =
CALCULATE(
[Revenue],
SAMEPERIODLASTYEAR(‘Date Table'[Date])
)
Once again, we turn to our DAX TARDIS, the CALCULATE function. The gauge visual says: "Filter the Revenue for each month in 2018"; but, by using CALCULATE with the SAMEPERIODLASTYEAR function, we are able to travel back in time one year, perform the calculation in the context of this offset period, and then effectively say to the visual: "Filter the Revenue for each month in the year preceding 2018".