


Similar Posts

Using the SAP Business Warehouse Application Server Data Source Connector in Power BI
Power BI is a powerful business analytics tool from Microsoft that allows users to visualize and share insights from their data. For businesses using SAP Business Warehouse (SAP BW) as their primary data source, integrating this data into Power BI can enhance decision-making and reporting capabilities. In this guide, we will walk through the process of using the SAP Business Warehouse Application Server (AS) Data Source Connector in Power BI.
Power BI Unleashed – Harnessing the Magic of Margin Variance Visualization
In today’s data-driven world, businesses are constantly striving to gain insights from their data to make informed decisions. Power BI, a powerful business intelligence tool developed by Microsoft, empowers organizations to transform raw data into visually compelling and interactive dashboards and reports. In this article, we will explore the magic of margin variance visualization using Power BI and how it can revolutionize the way businesses analyze and understand their profit margins.
MicroStrategy for Power BI
Power BI is a powerful business intelligence tool that allows organizations to analyze data and create visualizations that help inform business decisions. One of the key features of Power BI is the ability to connect to various data sources and extract data using Power Query. In this article, we will explore how to connect to a MicroStrategy data source from inside Power BI using Power Query M Language code.
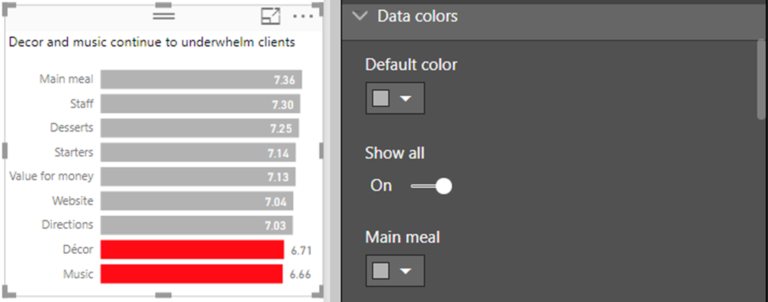
Power BI Business Narration
(G Com Solutions provide Power BI Training in London and throughout the UK.) Power BI reports can be very detailed and consist of many pages. Inevitably, there will be particular insights which it is important that consumers of the report do not miss. In the Power BI world, business narration means taking a journalistic approach…

Master the Art of Data Extraction – Downloading a PBIX File from the Power BI Service Demystified
Data analysis and visualization are integral components of modern businesses, and Power BI has emerged as a leading tool in this domain. Power BI Service offers a cloud-based platform for creating, publishing, and sharing interactive reports and dashboards. However, there might be instances when you need to extract a PBIX file from the Power BI Service to further analyze or modify the data offline. In this article, we will explore the process of downloading a PBIX file from the Power BI Service, providing you with the necessary guidance to master this art.
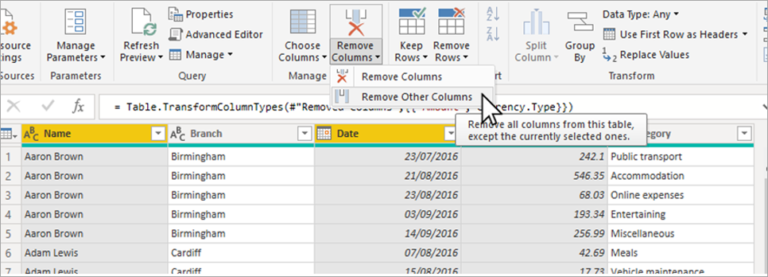
Power BI MCSA Certification Tips – Part 3 : Table.SelectColumns and Table.RemoveColumns
To obtain your MCSA: BI Reporting you need to pass two exams: 70-778 (Analyzing and Visualizing Data with Power BI) and 70-779 (Analyzing and Visualizing Data with Excel). However, there is a huge overlap between the two exams resulting from the common BI features found in both Power BI and Excel: namely data modelling using…