Power BI Sales Pipeline Solution
£23.40
Description
Since this solution deals with a sales pipeline, it contains a main fact table which contains multiple significant dates as we track the progress of each lead from the contact stage right through to sales. This means that we need to use Power BI’s role playing dimensions technique.
This solution will show you how to establish multiple relationships between your date and fact tables, and then use DAX to activate the appropriate relationship as you perform calculations.
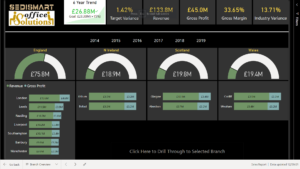
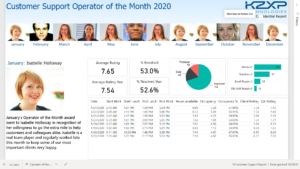
In terms of visualising our data, the solution shows how to use a hierarchy of images in slicers, which enable the user to track the performance of sales managers, as well as individual salespeople.
It also demonstrates a useful technique for creating a chart which only becomes visible when a particular slicer selection is made by the user.