Power Query is a powerful data transformation and analysis tool that is built into Microsoft Excel and Power BI. It allows users to connect to a wide range of data sources, including Salesforce Reports. In this article, we will explore how to use Power Query M Language code to connect to the Salesforce Reports data source from inside Power BI.
What is Power Query M Language Code?
Power Query M Language code is the scripting language used in Power Query to perform data transformations and manipulations. It is a functional programming language that supports a wide range of data manipulation functions, such as filtering, sorting, grouping, and aggregating data.
3. Enter your Salesforce login credentials and click on Connect.
4. Select the Salesforce Report you want to import into Power BI and click on Load.
This will import the selected Salesforce Report data into Power BI. However, sometimes we may need to perform additional data transformations or manipulations before loading the data into Power BI. This is where Power Query M Language code comes in handy.
Using Power Query M Language Code for Data Transformations
To perform data transformations using Power Query M Language code, we need to select the Transform Data option from the Home tab. This will open the Power Query Editor, where we can see the imported Salesforce Report data.
We can perform various data transformations by using the Query Editor interface, such as filtering, sorting, grouping, and aggregating data. However, sometimes we may need to perform more complex data transformations that are not available in the Query Editor interface. This is where Power Query M Language code can be used.
Power Query M Language code can be used to perform various data transformations, such as renaming columns, adding custom columns, and filtering data based on specific conditions. Let’s explore some examples of using Power Query M Language code for data transformations.
Renaming Columns
To rename a column in Power Query using M Language code, we can use the following syntax:
= Table.RenameColumns(
,{{,}})
For example, to rename the “Opportunity Name” column to “Name” in our Salesforce Report data, we can use the following code:
To add a custom column in Power Query using M Language code, we can use the following syntax:
= Table.AddColumn(
,,)
For example, to add a custom column “Status” that calculates the status of each opportunity in our Salesforce Report data based on the “Close Date” column, we can use the following code:
= Table.AddColumn(#”Renamed Columns”, “Status”, each if [Close Date] < DateTime.LocalNow() then "Closed" else "Open")
Filtering Data
To filter data in Power Query using M Language code, we can use the following syntax:
= Table.SelectRows(
,)
For example, to filter the Salesforce Report data to only show opportunities with a status of “Closed”, we can use the following code:
= Table.SelectRows(#”Added Custom Column”, each [Status] = “Closed”)
Conclusion
In this article, we explored how to use Power Query M Language code to connect to the Salesforce Reports data source from inside Power BI. We also looked at how to use Power Query M Language code to perform various data transformations, such as renaming columns, adding custom columns, and filtering data based on specific conditions. By using Power Query M Language code, we can perform complex data transformations and manipulations that are not available in the Query Editor interface.
Power BI Training Courses by G Com Solutions (0800 998 9248)
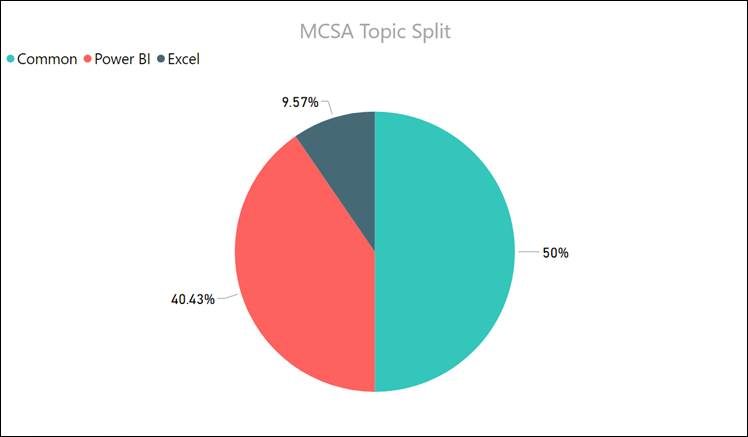
To obtain your MCSA: BI Reporting you need to pass two exams: 70-778 (Analyzing and Visualizing Data with Power BI) and 70-779 (Analyzing and Visualizing Data with Excel). However, there is a huge overlap between the two exams resulting from the common BI features found in both Power BI and Excel: namely data modelling using…
Power BI is an incredible data visualization tool that allows you to connect to various data sources, transform and clean data, and create beautiful and interactive reports and dashboards. One such data source is the Jamf Pro data source, which is a mobile device management solution for Apple devices. In this article, we will explore the Power Query M language code for connecting to the Jamf Pro data source from inside Power BI.
Connecting to a data source is a critical aspect of any data analysis process. It is the first step in building a data model, which forms the backbone of data visualizations and insights. In Power BI, there are different ways to connect to data sources, and one of the most powerful is through Dataflows. Dataflows are a feature in Power BI that allows you to extract, transform, and load data from a variety of sources.
Are you struggling to connect to the Planview Enterprise One – PRM data source from inside Power BI? If so, you’re not alone. Many users face this challenge, but fortunately, there is a solution that can make the process easier and more efficient. In this article, we’ll explore the Power Query M Language Code for connecting to the Planview Enterprise One – PRM data source from inside Power BI.
To obtain your MCSA: BI Reporting you need to pass two exams: 70-778 (Analyzing and Visualizing Data with Power BI) and 70-779 (Analyzing and Visualizing Data with Excel). I took the 70-778 last year; and was surprised, when the 70-779 exam was announced, at how much of an overlap there was between the two exams….
In the world of data analytics and visualization, Power BI stands as a powerhouse tool, enabling users to gain valuable insights from their datasets. One often overlooked yet impactful command within Power BI is the ‘Capitalize Each Word’ command. This powerful function allows you to transform text data by capitalizing the first letter of each word. In this article, we will dive deep into the ‘Capitalize Each Word’ command, exploring its benefits, how to use it effectively, best practices, and advanced techniques.