Unleashing the Power of Integration – Boosting Sales and Budget Analysis with Power BI
Integration has become a key factor in maximizing the potential of business operations. In the realm of data analysis and visualization, Power BI has emerged as a powerful tool that can significantly enhance sales and budget analysis. This article explores the various ways in which Power BI can be integrated into sales and budget analysis processes, highlighting its benefits, capabilities, and best practices.
Introduction
In today’s competitive business landscape, data holds the key to unlocking success. Organizations gather vast amounts of data from various sources, but without proper analysis and interpretation, it remains untapped potential. This is where Power BI steps in – a business intelligence tool developed by Microsoft that allows businesses to transform data into actionable insights.
Understanding Power BI
Power BI is a robust suite of business analytics tools that empowers organizations to visualize and analyze data. It provides a user-friendly interface and a wide range of functionalities, enabling users to connect to multiple data sources, create interactive dashboards, and generate meaningful reports. With its intuitive drag-and-drop interface, even non-technical users can harness the power of data analysis effectively.
Importance of Integration in Sales and Budget Analysis
In today’s dynamic business environment, sales and budget analysis require accurate and up-to-date information from various sources. Integration plays a vital role in ensuring that data from different systems and platforms is seamlessly consolidated for a comprehensive view. By integrating Power BI with sales and budget data, businesses can gain valuable insights, identify trends, and make informed decisions.
Benefits of Power BI for Sales and Budget Analysis
Integrating Power BI into sales and budget analysis processes offers numerous benefits. First and foremost, it enables organizations to gain a holistic view of their sales performance and financial health. With real-time data visualization, decision-makers can quickly identify areas of improvement, optimize resource allocation, and drive revenue growth. Moreover, Power BI provides interactive dashboards and reports that are accessible on various devices, enabling stakeholders to access critical information anytime, anywhere.
Integrating Power BI with Sales Data
One of the primary applications of Power BI is its integration with sales data. By connecting Power BI to sales databases, organizations can analyze their sales performance comprehensively. Power BI allows users to drill down into sales metrics, identify top-performing products or regions, and track sales trends over time. The ability to integrate multiple data sources, such as CRM systems, e-commerce platforms, and ERP software, further enriches the analysis and provides a comprehensive picture of the sales landscape.
Leveraging Power BI for Budget Analysis
Budget analysis is another area where Power BI can provide significant value. By integrating financial data with Power BI, organizations can closely monitor budget allocation, track expenditure patterns, and identify areas of overspending or underspending. Power BI’s intuitive visualizations and interactive reports make it easier for finance teams to communicate financial insights to stakeholders, enabling them to make informed decisions regarding budget adjustments and resource allocation.
How Power BI Enhances Data Visualization
Data visualization is a crucial aspect of sales and budget analysis. Power BI offers a wide range of visualization options, including charts, graphs, maps, and tables, to present data in a visually compelling and easy-to-understand manner. The interactive nature of Power BI allows users to explore data dynamically, drill down into specific details, and uncover hidden patterns or correlations. This enables decision-makers to grasp complex information quickly and derive actionable insights.
Using Power BI for Sales Forecasting
Accurate sales forecasting is essential for effective resource planning, inventory management, and overall business strategy. Power BI provides powerful forecasting capabilities that enable organizations to predict future sales based on historical data trends. By leveraging advanced algorithms and machine learning techniques, Power BI can generate accurate forecasts, helping businesses make informed decisions regarding production, marketing, and sales strategies.
Analyzing Sales Trends with Power BI
Identifying sales trends is crucial for understanding market dynamics and optimizing sales strategies. Power BI allows users to analyze sales data over different time periods, identify seasonal patterns, and detect emerging trends. By visualizing sales trends, organizations can adapt their marketing efforts, identify new growth opportunities, and stay ahead of the competition. Power BI’s ability to handle large datasets and perform complex calculations ensures that businesses can extract valuable insights from vast amounts of sales data.
Power BI’s Role in Identifying Budget Discrepancies
Maintaining a balanced budget is essential for financial stability and business growth. Power BI can play a vital role in identifying budget discrepancies by integrating financial data from various sources, such as accounting systems and expense management tools. By visualizing budget data alongside actual expenditure, Power BI can highlight areas where actual spending deviates from the allocated budget, enabling organizations to take corrective actions promptly.
Creating Interactive Dashboards with Power BI
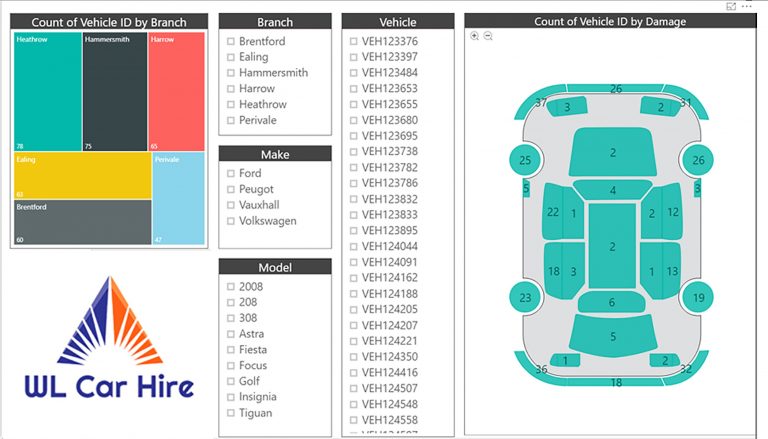
Dashboards provide a consolidated view of key metrics and indicators, allowing stakeholders to monitor performance at a glance. Power BI enables the creation of interactive dashboards that combine data from multiple sources, providing a comprehensive overview of sales and budget analysis. Users can customize dashboards, arrange visualizations, and set up filters to focus on specific metrics or segments. The interactive nature of Power BI dashboards facilitates data exploration, fosters collaboration, and empowers stakeholders to drive actionable insights.
Collaborating and Sharing Insights with Power BI
Effective collaboration is vital for data-driven decision-making. Power BI offers robust collaboration features, allowing users to share dashboards, reports, and insights with colleagues and stakeholders. By leveraging Power BI’s sharing capabilities, teams can collaborate in real-time, annotate reports, and exchange valuable feedback. Power BI also supports embedding dashboards and reports into other business applications, enabling seamless integration and information sharing across the organization.
Security and Privacy Considerations with Power BI
When dealing with sensitive data, security and privacy are of utmost importance. Power BI prioritizes data security by providing robust authentication, authorization, and encryption mechanisms. Organizations can control access to dashboards and reports, ensuring that only authorized individuals can view or interact with sensitive information. Power BI also complies with industry standards and regulations, such as GDPR, HIPAA, and ISO 27001, to safeguard data and protect user privacy.
Case Studies: Real-world Examples of Power BI Integration
To illustrate the practical applications of Power BI in sales and budget analysis, let’s explore a few real-world case studies:
Company X, a multinational retail corporation, integrated Power BI with its sales data to gain insights into regional performance, product profitability, and customer segmentation. By leveraging Power BI’s data visualization capabilities, Company X identified underperforming regions, optimized its product portfolio, and tailored marketing strategies based on customer preferences.
Organization Y, a financial services company, utilized Power BI for budget analysis. By integrating their financial data with Power BI, Organization Y gained a comprehensive view of their expenditure patterns, identified cost-saving opportunities, and optimized budget allocation. The interactive dashboards and reports provided by Power BI allowed finance teams to collaborate effectively and present financial insights to senior management.
Nonprofit Organization Z integrated Power BI with their fundraising data to analyze donor contributions, track campaign effectiveness, and measure the impact of their programs. Power BI’s visualizations helped Organization Z identify fundraising trends, target high-value donors, and allocate resources strategically to maximize their fundraising efforts.
These case studies demonstrate the versatility and effectiveness of Power BI in various industries and use cases, highlighting its ability to empower organizations with actionable insights and drive data-informed decision-making.
Best Practices for Implementing Power BI Integration
To maximize the benefits of Power BI integration in sales and budget analysis, consider the following best practices:
Define clear objectives: Clearly define your goals and objectives for utilizing Power BI in sales and budget analysis. Identify the key metrics and insights you want to derive from the data.
Data quality and preparation: Ensure that your data is accurate, complete, and properly prepared for integration with Power BI. Perform data cleansing, transformation, and validation to enhance data quality.
Choose relevant data sources: Identify the relevant data sources for sales and budget analysis, such as CRM systems, financial databases, and marketing platforms. Integrate these sources with Power BI to consolidate data for comprehensive analysis.
Design intuitive dashboards: Create intuitive and user-friendly dashboards that present data in a visually appealing and easy-to-understand manner. Consider the needs and preferences of different stakeholders when designing dashboards.
Regularly update and refresh data: Maintain up-to-date data by scheduling regular data refreshes. This ensures that the insights derived from Power BI are based on the latest information.
Foster collaboration: Encourage collaboration and knowledge sharing among teams by leveraging Power BI’s collaboration features. Enable users to share dashboards, reports, and insights to facilitate effective decision-making.
Train and empower users: Provide training and support to users to ensure they can utilize Power BI effectively. Empower users to explore data, create their own reports, and derive actionable insights.
Monitor and analyze performance: Continuously monitor the performance of your sales and budget analysis efforts using Power BI. Analyze key metrics, track progress, and make data-driven adjustments to improve outcomes.
By following these best practices, organizations can unlock the full potential of Power BI in sales and budget analysis, driving informed decision-making and achieving tangible business results.
Conclusion
Integrating Power BI into sales and budget analysis processes can revolutionize the way organizations leverage data for decision-making. With its powerful analytics capabilities, interactive visualizations, and collaborative features, Power BI empowers businesses to uncover valuable insights, optimize sales strategies, and enhance financial planning. By embracing the power of integration, organizations can unleash the full potential of Power BI and drive success in today’s data-driven business landscape.
FAQs
1. Can Power BI integrate with multiple data sources?
Yes, Power BI supports integration with various data sources, including databases, cloud platforms, and third-party applications. It allows businesses to consolidate data from different sources for comprehensive analysis.
2. Is Power BI suitable for non-technical users?
Absolutely. Power BI provides a user-friendly interface and intuitive drag-and-drop functionalities, making it accessible to both technical and non-technical users. No coding skills are required to harness the power of Power BI.
3. How can Power BI enhance sales forecasting?
Power BI leverages advanced algorithms and machine learning techniques to analyze historical sales data and generate accurate forecasts. This enables organizations to predict future sales trends and make data informed decisions regarding production, marketing, and sales strategies.
4. Is Power BI secure for handling sensitive data?
Yes, Power BI prioritizes data security and offers robust authentication, authorization, and encryption mechanisms. Organizations can control access to sensitive data and ensure compliance with industry standards and regulations, providing a secure environment for data analysis and visualization.
5. Can Power BI be used for real-time data analysis?
Yes, Power BI allows real-time data analysis by enabling organizations to connect to streaming data sources. This feature enables businesses to monitor and analyze data as it is generated, facilitating quick decision-making and proactive actions.
6. How can Power BI benefit budget analysis?
Power BI enhances budget analysis by integrating financial data from various sources, providing a comprehensive view of expenditure patterns and budget discrepancies. It helps organizations identify cost-saving opportunities, optimize resource allocation, and make data-driven decisions to ensure financial stability and growth.
7. Can Power BI be used for collaboration and sharing insights?
Absolutely. Power BI offers robust collaboration features that enable users to share dashboards, reports, and insights with colleagues and stakeholders. This fosters effective collaboration, facilitates knowledge sharing, and enables stakeholders to make informed decisions based on shared insights.
8. Can Power BI be customized to suit specific business needs?
Yes, Power BI provides extensive customization options. Users can tailor dashboards, reports, and visualizations to align with their specific business needs and preferences. Power BI offers a range of customization features, allowing organizations to create personalized data analysis solutions.


