Data Insights at Your Fingertips – Unlocking the Potential of Measures in Power BI
Introduction
In today’s data-driven world, organizations rely on powerful tools and platforms to extract valuable insights from their data. Microsoft Power BI has emerged as one of the leading business intelligence solutions, providing users with the ability to visualize and analyze data in a meaningful way. Central to the success of Power BI is the concept of measures. In this article, we will explore the significance of measures in Power BI and how they can unlock the potential of data insights.
What is Power BI?
Power BI is a suite of business analytics tools developed by Microsoft. It allows users to connect to various data sources, transform and shape the data, and create interactive visualizations and reports. With Power BI, organizations can gain valuable insights into their data, make data-driven decisions, and share these insights with others.
The Importance of Measures in Power BI
Measures are a fundamental component of Power BI that enable users to perform calculations and aggregations on their data. They are essential for creating meaningful metrics and KPIs, which help in tracking and monitoring key business performance indicators. Measures allow users to summarize, analyze, and compare data, providing valuable insights into the underlying patterns and trends.
Understanding Data Insights

Data insights refer to the meaningful interpretations and discoveries derived from data analysis. With Power BI, users can uncover hidden patterns, identify trends, and gain a deeper understanding of their data. These insights can drive strategic decision-making, improve operational efficiency, and identify areas for business growth and improvement.
Leveraging Measures for Data Analysis
Measures in Power BI play a crucial role in data analysis. They allow users to perform calculations, such as sum, average, maximum, minimum, and more, on specific data fields or columns. By defining measures, users can create customized metrics that align with their business requirements, providing a holistic view of the data and facilitating data-driven decision-making.
Creating Measures in Power BI
To create a measure in Power BI, users can utilize the Data Analysis Expressions (DAX) language. DAX provides a rich set of functions and operators that enable users to define complex calculations and aggregations. Users can create measures by writing DAX expressions that reference the underlying data fields and perform the desired calculations.
Using DAX Expressions for Measure Calculation
DAX expressions are the building blocks of measures in Power BI. These expressions can include functions, operators, and references to columns or tables. With DAX, users can implement advanced calculations, create conditional measures, apply filters, and perform time intelligence calculations. The flexibility and power of DAX allow users to unlock the full potential of their data.
Advanced Measure Techniques

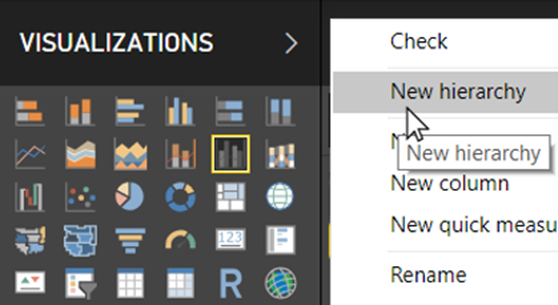
Power BI offers advanced techniques for working with measures. Users can leverage features like calculated tables, calculated columns, and hierarchies to enhance their data analysis capabilities. Calculated tables allow users to create new tables based on calculations, while calculated columns enable the creation of new columns derived from existing data. Hierarchies help in organizing and navigating data at different levels of granularity.
Visualizing Measure Results
Power BI provides a wide range of visualization options to present measure results effectively. Users can choose from various chart types, such as bar charts, line charts, pie charts, and scatter plots, to visualize their data insights. Additionally, Power BI allows for interactive exploration of measures through drill-down, slicers, and filters, enabling users to dive deeper into their data and uncover valuable insights.
Sharing and Collaborating on Power BI Reports
Power BI offers robust sharing and collaboration capabilities, allowing users to share their reports and dashboards with colleagues, clients, or stakeholders. Users can publish their Power BI reports to the Power BI service or SharePoint Online, granting access to authorized individuals. This enables seamless collaboration, real-time data updates, and interactive exploration of measures, promoting data-driven decision-making across the organization.
Benefits of Data Insights in Power BI
Harnessing the power of measures and data insights in Power BI brings numerous benefits to organizations. Some of the key advantages include:

Improved Decision-Making: Data insights derived from measures enable informed decision-making, leading to better business outcomes.
Enhanced Performance Monitoring: Measures provide real-time monitoring of key performance indicators, allowing organizations to track progress and identify areas for improvement.
Data-Driven Strategy: By analyzing data insights, organizations can align their strategies with market trends and customer demands, gaining a competitive edge.
Operational Efficiency: Power BI measures streamline data analysis processes, saving time and effort while providing accurate and up-to-date information.

Collaborative Environment: Power BI’s sharing and collaboration features foster a collaborative work environment, enabling teams to work together and share insights effortlessly.
Best Practices for Utilizing Measures in Power BI
To maximize the potential of measures in Power BI, it is essential to follow some best practices:
Define Clear Objectives: Clearly define the objectives and metrics you want to measure to ensure alignment with business goals.
Keep Measures Simple: Avoid complex calculations and focus on simplicity to enhance readability and maintain performance.
Use Descriptive Names: Give measures meaningful and descriptive names to improve understanding and ease of use.
Validate and Test Measures: Validate and test your measures against known values and scenarios to ensure accuracy and reliability.
Document Measures: Document your measures, including their purpose, formula, and any dependencies, to facilitate knowledge sharing and maintain consistency.
Overcoming Challenges in Power BI Measure Implementation

While Power BI offers powerful features for measure implementation, there can be challenges along the way. Some common challenges and their solutions include:
Data Quality: Ensure data quality by performing data cleansing and validation before implementing measures.
Complex Calculations: Break down complex calculations into smaller, manageable steps for easier implementation and troubleshooting.
Performance Optimization: Optimize measures for performance by minimizing resource-intensive calculations and leveraging caching techniques.
User Adoption: Promote user adoption by providing training and resources to help users understand the value and usage of measures.
Iterative Improvement: Continuously review and improve measures based on feedback and evolving business requirements.
Future Trends in Power BI and Data Insights
The field of data insights and Power BI is constantly evolving. Some emerging trends to watch for include:

Natural Language Processing: Power BI is likely to integrate advanced natural language processing capabilities, enabling users to interact with data using conversational language.
Augmented Analytics: Power BI will leverage machine learning and artificial intelligence to provide automated insights and intelligent recommendations.
Data Democratization: Power BI will continue to empower business users by making data analysis accessible to a broader audience, reducing the dependency on data experts.
Enhanced Data Connectivity: Power BI will offer more connectors and seamless integration with a wide range of data sources, allowing users to access and analyze data from diverse platforms.

Embedded Analytics: Power BI will enable the embedding of analytics capabilities within other applications, enhancing the seamless integration of data insights into various business processes and workflows.
Conclusion
Power BI has revolutionized the way organizations analyze and leverage data insights. Measures form the backbone of Power BI, enabling users to perform calculations, analyze trends, and derive valuable insights from their data. By understanding the importance of measures, creating meaningful calculations using DAX expressions, and visualizing the results, organizations can unlock the full potential of Power BI and make data-driven decisions.

With the ability to share and collaborate on reports, organizations can foster a data-driven culture and empower teams to work together towards common goals. By following best practices, overcoming implementation challenges, and staying abreast of future trends, organizations can harness the true power of measures in Power BI and drive success in their data analysis initiatives.
FAQs
1. Can I create custom measures in Power BI?
Yes, Power BI allows users to create custom measures using the Data Analysis Expressions (DAX) language. DAX provides a wide range of functions and operators to perform calculations and aggregations on data fields.
2. Can I share Power BI reports with others outside my organization?
Yes, Power BI offers sharing and collaboration features that allow you to share reports with individuals outside your organization. You can publish your reports to the Power BI service or SharePoint Online and grant access to authorized users.
3. How can measures help in performance monitoring?
Measures provide real-time monitoring of key performance indicators (KPIs). By defining measures that track specific metrics, organizations can keep a close eye on performance, identify deviations from targets, and take proactive measures to improve results.
4. What are some advanced techniques for working with measures in Power BI?
Power BI offers advanced techniques such as calculated tables, calculated columns, and hierarchies. Calculated tables allow users to create new tables based on calculations, calculated columns enable the creation of new columns derived from existing data, and hierarchies help in organizing and navigating data at different levels of granularity.
5. Is Power BI suitable for small businesses?
Yes, Power BI caters to businesses of all sizes. It offers flexible pricing plans and scalability options, making it suitable for small businesses as well. Small businesses can leverage Power BI to gain valuable insights from their data, make informed decisions, and drive growth.