Supercharge Your Data Insights – Unleashing Budget Variance Analysis with Power BI
In today’s fast-paced business environment, organizations need to make informed decisions quickly and accurately. One crucial aspect of effective financial management is budget variance analysis. By comparing actual expenses and revenues against the planned budget, companies can gain valuable insights into their financial performance and make necessary adjustments. However, traditional methods of budget variance analysis often fall short in delivering timely and actionable insights. In this article, we will explore how you can supercharge your data insights by unleashing the power of Power BI for budget variance analysis.
Understanding Budget Variance Analysis
Definition of Budget Variance Analysis
Budget variance analysis involves comparing actual financial results with the projected budget to identify discrepancies. It provides a clear picture of how well an organization is adhering to its financial plans. By analyzing these variances, businesses can pinpoint areas of overspending or cost savings, allowing for more effective financial management.
Importance of Budget Variance Analysis
Budget variance analysis is a critical tool for effective financial planning and control. It helps organizations:
Identify potential financial risks and opportunities
Improve resource allocation and cost management
Enhance decision-making based on accurate financial insights
Facilitate performance evaluation against predetermined goals
Challenges in Traditional Budget Variance Analysis
While budget variance analysis is essential, traditional methods often come with several challenges that hinder its effectiveness.
Manual data processing

Traditional budget variance analysis requires extensive manual data processing. Consolidating data from multiple sources, reconciling figures, and performing calculations manually can be time-consuming and prone to errors. This manual approach also limits the frequency at which analysis can be performed, delaying decision-making processes.
Lack of real-time insights
In a dynamic business environment, real-time insights are crucial for effective decision-making. Traditional budget variance analysis typically relies on periodic reporting, which may not provide the most up-to-date information. Without real-time visibility into financial performance, organizations may miss critical opportunities or fail to address potential issues promptly.
Limited data visualization capabilities
Presenting complex financial data in a meaningful way is a challenge with traditional budget variance analysis methods. Tabular reports and spreadsheets often fail to convey insights effectively, making it difficult for stakeholders to grasp the implications of variances. Without clear and visually appealing visualizations, decision-makers may struggle to interpret the data accurately.
Introducing Power BI for Budget Variance Analysis
To overcome the limitations of traditional budget variance analysis, organizations can turn to Power BI, a powerful business intelligence tool developed by Microsoft. Power BI provides a comprehensive solution for data visualization, analysis, and reporting, enabling businesses to unlock the full potential of their financial data.
Overview of Power BI

Power BI is a cloud-based platform that allows users to connect to various data sources, transform raw data into meaningful insights, and create interactive visualizations and reports. It offers a user-friendly interface and a wide range of tools and features that empower users to analyze data effectively.
Benefits of using Power BI for budget variance analysis
Real-time data updates: Power BI allows for real-time data integration, enabling organizations to monitor budget variances as they occur. With up-to-date information at their fingertips, decision-makers can make timely adjustments and take proactive measures to stay on track.
Interactive visualizations: Power BI offers a rich set of visualization options, including charts, graphs, and interactive dashboards. These visual representations make it easier for stakeholders to understand complex financial data and identify patterns or trends.
Data integration: Power BI can connect to a wide range of data sources, such as Excel spreadsheets, databases, and cloud services. This integration capability enables businesses to consolidate data from multiple systems and gain a holistic view of their financial performance.

Ad-hoc analysis: Power BI allows users to perform ad-hoc analysis on their budget data. With intuitive drag-and-drop functionalities and powerful data modeling capabilities, users can explore different dimensions of their budget variances and drill down into specific areas for deeper insights.
Collaboration and sharing: Power BI enables easy collaboration and sharing of reports and dashboards within the organization. Stakeholders can access the latest budget variance analysis reports, provide feedback, and collaborate on decision-making processes in a centralized and secure environment.
How to Supercharge Your Data Insights with Power BI
Now that we understand the benefits of using Power BI for budget variance analysis, let’s explore how to leverage its capabilities to supercharge your data insights.
Data preparation and integration
The first step in utilizing Power BI for budget variance analysis is to ensure that your data is well-prepared and integrated. This involves connecting to relevant data sources, cleansing and transforming the data, and structuring it in a way that facilitates analysis.

Identify data sources: Determine the data sources that are relevant to your budget variance analysis, such as accounting systems, ERP software, or spreadsheets.
Connect to data sources: Use Power BI’s built-in connectors to establish connections with your data sources. Power BI supports a wide range of connectors, making it easy to extract data from various systems.
Cleanse and transform data: Cleanse the data by removing any duplicates, inconsistencies, or errors. Then, transform the data to ensure it is in the appropriate format for analysis. Power BI provides a user-friendly interface for data transformation tasks.
Create data relationships: Establish relationships between different data tables to enable seamless analysis across multiple data sources. Power BI’s data modeling capabilities make it easy to define relationships based on common fields or keys.
Creating visualizations and reports
Once your data is prepared, you can start creating visualizations and reports to analyze budget variances effectively.

Select appropriate visuals: Choose the most suitable visualizations, such as bar charts, line charts, or heatmaps, to represent your budget variance data. Power BI offers a wide range of customizable visuals to cater to different analysis needs.
Design interactive dashboards: Create interactive dashboards that provide an overview of key budget variances and allow users to explore the data dynamically. Power BI’s drag -and-drop interface makes it easy to arrange visuals and create interactive elements like filters, slicers, and drill-through options.
Apply data filters: Use data filters to focus on specific time periods, departments, or cost categories. This allows you to analyze budget variances at different levels of granularity and gain deeper insights into the factors driving the variances.
Utilize calculated measures: Power BI enables the creation of calculated measures based on your budget variance analysis requirements. These measures can include metrics like variance percentages, cumulative variances, or cost-saving opportunities. Calculated measures provide additional context and help in understanding the magnitude of the variances.
Analyzing budget variances in real-time

With Power BI, you can monitor budget variances in real-time and take proactive actions to address any deviations from the planned budget.
Set up data refresh: Configure scheduled data refresh or real-time data streaming to ensure that your budget variance analysis is based on the latest information. Power BI allows you to automate data updates from your connected data sources.
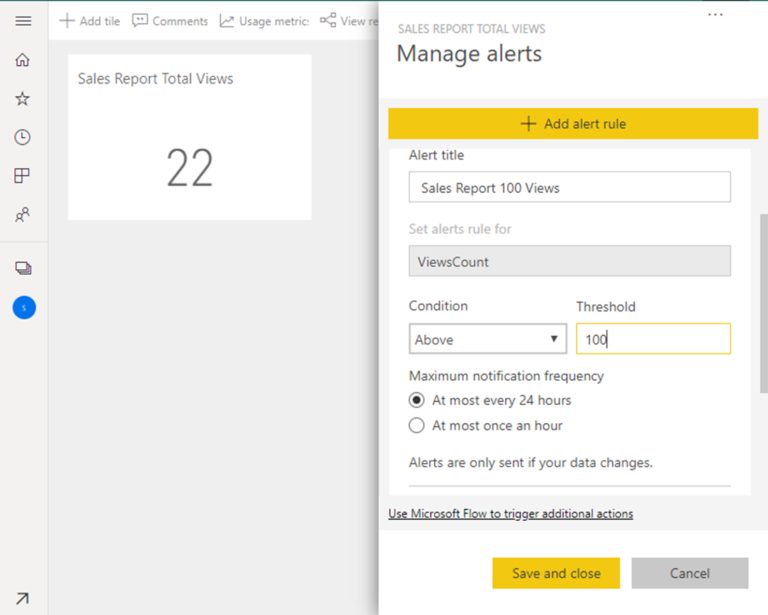
Create alerts and notifications: Define thresholds or triggers that will generate alerts or notifications when budget variances exceed certain limits. This proactive approach enables you to promptly identify and address significant deviations from the budget.
Perform what-if analysis: Power BI’s analytical capabilities extend beyond traditional budget variance analysis. You can leverage its “What If” feature to simulate the impact of potential changes in the budget assumptions or cost drivers. This allows you to assess different scenarios and make informed decisions accordingly.
Best Practices for Effective Budget Variance Analysis
To ensure the success of your budget variance analysis using Power BI, consider the following best practices:

Set clear goals and objectives: Clearly define the goals and objectives of your budget variance analysis. Determine the key performance indicators (KPIs) and metrics that align with your organization’s financial objectives.
Define relevant KPIs and metrics: Choose KPIs and metrics that provide meaningful insights into your budget variances. These could include revenue variances, expense variances, profit margins, or return on investment (ROI). Select metrics that align with your industry and organizational goals.

Regularly monitor and review variances: Establish a regular cadence for monitoring and reviewing budget variances. This ensures that deviations from the budget are promptly identified and addressed. Schedule periodic reviews with relevant stakeholders to discuss the analysis findings and identify corrective actions.
Communicate insights effectively: When presenting budget variance analysis, focus on clear and concise communication. Use Power BI’s visualizations to convey key messages effectively. Provide narratives and context around the variances to help stakeholders understand the implications and make informed decisions.
Case Study: Successful Implementation of Power BI for Budget Variance Analysis
Let’s explore a case study to understand how an organization successfully implemented Power BI for budget variance analysis and achieved significant improvements in their decision-making processes.
Company X’s experience with Power BI
Company X, a multinational manufacturing company, struggled with traditional budget variance analysis methods due to manual data processing and limited data visualization capabilities. They decided to implement Power BI to streamline their budget variance analysis and gain real-time insights into their financial performance.
By leveraging Power BI’s features and capabilities, Company X was able to:
Consolidate data from multiple sources, including their ERP system and financial software, to create a centralized data repository.
Transform raw data into interactive visualizations and reports that provided real-time visibility into budget variances.
Implement automated data refresh and alerts to promptly identify and address significant budget deviations.
Collaborate and share budget variance reports with stakeholders across different departments, enabling better cross-functional decision-making.
Positive outcomes and improved decision-making
The implementation of Power BI revolutionized Company X’s budget variance analysis process. The organization experienced several positive outcomes and improvements in their decision-making processes:
Faster insights: With real-time data updates and interactive dashboards, Company X gained immediate insights into their budget variances. This accelerated their decision-making processes and allowed them to take timely actions to address budget deviations.
Improved accuracy: Power BI’s automated data integration and cleansing processes reduced the risk of errors and inconsistencies in the budget variance analysis. This resulted in more accurate financial insights and enhanced confidence in the analysis outcomes.
Enhanced collaboration: Power BI’s collaboration features facilitated seamless sharing of budget variance reports and dashboards among stakeholders. This enabled better collaboration and alignment across departments, leading to more informed decision-making.
Increased cost savings: By regularly monitoring and analyzing budget variances in real-time, Company X identified cost-saving opportunities more effectively. They were able to take proactive measures to reduce expenses and optimize resource allocation, resulting in significant cost savings.
Strategic planning: Power BI’s ad-hoc analysis capabilities allowed Company X to perform deeper dives into their budget variances. They gained valuable insights into the underlying factors driving the variances and used this information to refine their strategic planning processes.
Overall, the implementation of Power BI empowered Company X with the ability to supercharge their data insights and make data-driven decisions based on accurate and real-time budget variance analysis.
Conclusion
Budget variance analysis plays a crucial role in effective financial management, providing insights into an organization’s adherence to its financial plans. However, traditional methods often fall short in delivering timely and actionable insights. By harnessing the power of Power BI, organizations can supercharge their data insights and unleash the full potential of budget variance analysis.
With Power BI, you can leverage real-time data updates, interactive visualizations, and ad-hoc analysis capabilities to gain a deeper understanding of your budget variances. By following best practices and utilizing the features of Power BI effectively, you can enhance decision-making, improve resource allocation, and drive cost savings.
Don’t miss out on the opportunity to transform your budget variance analysis. Supercharge your data insights today with Power BI.
FAQs
What is the cost of implementing Power BI?
The cost of implementing Power BI depends on various factors, such as the size of your organization, licensing requirements, and additional features needed. Microsoft offers different pricing plans, including free and paid options, to cater to different business needs.
Can Power BI handle large volumes of data?
Yes, Power BI is designed to handle large volumes of data. It can connect to various data sources, including big data platforms and cloud services, and has robust data processing capabilities to handle and analyze substantial datasets.
Is Power BI suitable for non-technical users?
Absolutely! Power BI’s user-friendly interface and intuitive drag-and-drop functionalities make it accessible to both technical and non-technical users. The platform provides a range of pre-built templates and guides to assist users in creating compelling visualizations and reports.
Can Power BI integrate with other data sources?
Yes, Power BI offers extensive integration capabilities. It can connect to various data sources, such as databases, cloud services, Excel spreadsheets, and more. Power BI also supports APIs and custom connectors, allowing you to connect to specialized data sources.
Are there any security concerns with Power BI?
Power BI prioritizes data security and provides robust security measures. It supports encryption at rest and in transit, as well as multi-factor authentication. Additionally, you can define access permissions and roles to ensure that sensitive data is only accessible to authorized individuals.