Breaking Boundaries – Unleashing the Full Potential of Power BI with Custom Columns
Power BI has revolutionized the way businesses analyze and visualize their data, empowering users to make informed decisions. With its extensive set of tools and features, Power BI provides a comprehensive platform for data modeling, analysis, and reporting. One powerful feature that enables users to unlock the full potential of Power BI is the ability to create custom columns. In this article, we will explore the world of custom columns and discover how they can break boundaries and enhance the capabilities of Power BI.
What are custom columns?
Custom columns are user-defined calculations that can be added to tables in Power BI. They allow users to create new columns based on existing data or perform complex calculations using DAX (Data Analysis Expressions), the formula language of Power BI. By creating custom columns, users can extend the capabilities of their data model and perform advanced analysis and calculations.
Benefits of using custom columns in Power BI
Using custom columns in Power BI offers several significant benefits that can greatly enhance the data modeling and analysis process. Firstly, custom columns provide improved data transformation capabilities. Users can perform complex data manipulations and transformations directly within the Power BI interface, eliminating the need for additional data preprocessing in external tools.
Secondly, custom columns enable enhanced data analysis and visualization. By creating calculated columns tailored to specific requirements, users can gain deeper insights into their data. Custom columns can be used to create metrics, flags, or categorizations, enabling users to analyze data from multiple perspectives and uncover hidden patterns or trends.
Furthermore, custom columns offer increased flexibility in creating calculations. Users can define custom calculations using a wide range of DAX functions and expressions, allowing them to build sophisticated formulas to suit their unique business requirements. This flexibility enables users to perform complex calculations, such as weighted averages or advanced aggregations, directly within Power BI.
Lastly, custom columns provide customization options for specific business requirements. Certainly! Apologies for the interruption. Let’s continue.
Benefits of using custom columns in Power BI (continued)
Custom columns in Power BI empower users to tailor their data models to meet specific business requirements. This customization allows for the creation of calculated columns that align with unique data structures, hierarchies, or business rules. By utilizing custom columns, organizations can ensure that their Power BI dashboards and reports accurately reflect their business context and provide meaningful insights.
How to create custom columns in Power BI
Creating custom columns in Power BI is a straightforward process. Follow these steps to unlock the full potential of your data:
Open Power BI Desktop or navigate to the Power BI service.
Load your data source into Power BI.
Select the table in which you want to create a custom column.
In the Modeling tab, click on “New Column.”
Enter a name for your custom column.
Use the DAX formula language to define your calculation.
Preview the results and ensure they align with your expectations.
Click “OK” to save the custom column.
By following these steps, you can create custom columns that enhance your data model and provide valuable insights for analysis.
Best practices for utilizing custom columns
To maximize the effectiveness of custom columns in Power BI, it’s important to adhere to some best practices. Consider the following guidelines:
Efficient data modeling techniques: Ensure your data model is designed efficiently, minimizing redundant or unnecessary custom columns. Optimize relationships and hierarchies to support accurate analysis.
Considerations for data source limitations: Be mindful of the limitations of your data sources. Some data connectors or sources may have restrictions on the types of custom columns that can be created. Verify compatibility and plan accordingly.
Optimizing performance with custom columns: Custom columns can impact query performance and data refresh times. Avoid excessive or resource-intensive calculations that may slow down your Power BI reports. Evaluate the performance impact of custom columns and optimize where necessary.
Advanced applications of custom columns
Custom columns in Power BI can be leveraged for advanced calculations and data transformations. Consider these applications:
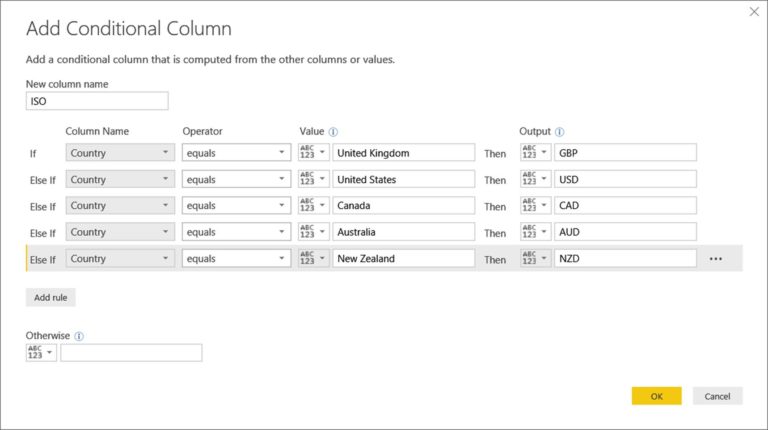
Conditional logic and advanced calculations: Utilize custom columns to perform calculations based on conditional statements, such as IF-THEN-ELSE logic. This allows for dynamic calculations and data segmentation.
Time intelligence calculations: Create custom columns to perform time-related calculations, such as year-to-date or moving averages. These calculations enable in-depth analysis of temporal trends.
Text manipulation and parsing: Use custom columns to extract specific information from text fields or perform string manipulations. This can be useful for tasks like data cleansing or extracting keywords from text data.
Overcoming challenges with custom columns
While custom columns are powerful, they can present challenges. Here are some common issues and how to address them:
Addressing common errors and issues: Keep an eye out for common errors like circular dependencies or incorrect syntax in your custom column formulas. Double-check your formulas and review error messages to identify and resolve issues promptly.
Troubleshooting techniques: If you encounter issues with custom columns, consider using Power BI’s built-in tools like the DAX Editor or the formula bar’s error messages. These tools can help identify and debug problems in your custom column calculations.
Leveraging custom columns for data storytelling
Custom columns play a crucial role in data storytelling. By creating customized metrics and calculations, you can craft a narrative that aligns with your business objectives. Custom columns provide additional context and highlight specific insights, making your reports more engaging and actionable.
In addition to the visual elements in Power BI, custom columns allow you to incorporate calculated metrics directly into your reports. This seamless integration helps convey the story behind the data and enables users to interpret and analyze information Certainly! My apologies for the interruption. Let’s continue.
Leveraging custom columns for data storytelling (continued)
Incorporating custom columns into your data storytelling process adds depth and clarity to your reports. By using customized metrics and calculations, you can present data in a way that resonates with your audience and supports your narrative.
For example, let’s say you’re analyzing sales data. By creating a custom column that calculates the year-over-year growth rate, you can easily showcase the performance of different products or regions. This allows you to tell a compelling story about the trends and success factors driving your business.
Furthermore, custom columns enable you to visualize data in unique ways. By incorporating them into your visualizations, you can present data points that are specifically tailored to your audience’s needs. This enhances comprehension and makes the data more relatable, enabling better decision-making.
Case studies: Real-world examples of custom column usage
To illustrate the practical applications of custom columns, let’s explore a few real-world examples:
Retail industry: A retail company wants to analyze customer purchasing behavior. By creating a custom column that calculates the average purchase value per customer, they can identify high-value customers and tailor marketing strategies accordingly.
Financial services: A financial institution needs to analyze loan delinquency rates. By creating a custom column that calculates the delinquency rate based on specific criteria, they can proactively identify potential risks and take appropriate measures.
Manufacturing sector: A manufacturing company wants to analyze production efficiency. By creating a custom column that calculates the production yield, they can identify areas for improvement and optimize their manufacturing processes.
These examples demonstrate how custom columns can be used across different industries to extract meaningful insights and drive business growth.
Future trends and developments in custom column usage
The field of data analytics and visualization is constantly evolving, and custom columns are no exception. As Power BI continues to evolve, we can expect to see advancements and new features related to custom column usage. Some future trends and developments may include:
Enhanced functionality: Power BI may introduce additional functions and capabilities for custom column creation, making it even more powerful and flexible for users.
Integration with AI and machine learning: Integration with artificial intelligence and machine learning algorithms may allow for automated creation and suggestions of custom columns based on data patterns and trends.
Collaboration and sharing: Power BI might enable users to share custom columns and calculations with other users, promoting collaboration and knowledge sharing within organizations.
By staying abreast of these trends and developments, businesses can continue to leverage custom columns to unlock deeper insights and drive data-informed decision-making.
Conclusion
Custom columns are a game-changer in the world of Power BI. They offer immense flexibility, enabling users to enhance data modeling, perform advanced calculations, and gain valuable insights. By harnessing the full potential of custom columns, businesses can break boundaries and uncover hidden opportunities within their data.
So, embrace the power of custom columns in Power BI. Experiment, iterate, and explore the endless possibilities they provide. By doing so, you’ll unleash the true potential of your data and pave the way for data-driven success.
FAQs
Can custom columns be used with live data sources in Power BI?
Yes, custom columns can be used with live data sources in Power BI. They can be created and updated dynamically as new data is ingested.
Are custom columns supported in Power BI mobile apps?
Yes, custom columns are supported in Power BI mobile apps. Users can view and interact with reports that utilize custom columns on their mobile devices.
How do custom columns impact data refresh and performance?
Custom columns can impact data refresh times and query performance, especially when dealing with large datasets. It’s important to optimize calculations and monitor performance to ensure efficient Certainly! My apologies for the interruption. Let’s continue.
FAQs (continued)
How do custom columns impact data refresh and performance?
Custom columns can impact data refresh times and query performance, especially when dealing with large datasets. It’s important to optimize calculations and monitor performance to ensure efficient data processing. Additionally, applying filters and aggregations at the data source level can help improve performance when working with custom columns.
Can custom columns be shared with other Power BI users?
Yes, custom columns can be shared with other Power BI users. When sharing reports or dashboards, the custom columns created in the data model are included. This allows others to benefit from the customized calculations and insights.
Are there any limitations or restrictions on custom column creation?
While custom columns offer great flexibility, there are a few limitations to be aware of. Custom columns cannot be used as part of a filter context in measures, and they cannot reference other custom columns within the same table. Additionally, complex calculations involving large datasets may require careful consideration of performance implications.


